Debugging Linyaps Applications
This tutorial uses an example project with the application ID org.deepin.demo. Prepare and build the application as shown below before debugging it. For your own application, replace the application ID, executable, and project paths with the corresponding values.
Prepare the Debugging Example
Create the Project
Create org.deepin.demo under /tmp:
cd /tmp
ll-builder create org.deepin.demo
cd org.deepin.demo
ll-builder create generates /tmp/org.deepin.demo/linglong.yaml. The remaining commands use that directory as the project root.
Configure linglong.yaml
Change the generated linglong.yaml to:
version: "1"

package:
  id: org.deepin.demo
  name: demo
  kind: app
  version: 1.0.0.0
  description: |
    A simple demo app.

command:
  - demo

base: org.deepin.base/23.1.0
runtime: org.deepin.runtime.dtk/23.1.0

sources:
  - kind: git
    url: "https://github.com/linuxdeepin/linglong-builder-demo.git"
    commit: master
    name: linglong-builder-demo

build: |
  cd /project/linglong/sources/linglong-builder-demo
  rm -rf build || true
  mkdir build
  cd build
  qmake PREFIX=${PREFIX} ..
  make
  make install
This configuration obtains the qmake example from linglong-builder-demo and compiles and installs it in the build container. The application ID, executable name, and debug-symbol paths used below correspond to this configuration.
Build and Validate
Run these commands under /tmp/org.deepin.demo:
ll-builder build
ll-builder run
Begin debugging only after confirming that the application runs normally. If the build fails, fix it first; debugging commands can use only successfully generated artifacts.
Debugging with gdb in Terminal
Running Application in Debug Environment
ll-builder run -- bash enters the application's runtime container. Add --debug to run the container in debug mode. The main differences are:
- Debug mode uses the binary+develop modules of the Base and Runtime, while normal mode enables only binary. Tools such as GDB are provided by the Base's develop module.
- Debug mode uses the App's binary+develop modules, while normal mode uses binary by default. Debug symbols are normally saved in develop.
- Debug mode generates
linglong/gdbinitin the project and mounts it at~/.gdbinitin the container.
Run ll-builder run --debug -- bash in the project, then start GDB with gdb /opt/apps/org.deepin.demo/files/bin/demo. It works like command-line debugging on the host because linglong/gdbinit provides the required initial configuration.
Debugging Application in Runtime Environment
The debug environment differs slightly from a user's normal runtime environment. To debug the installed application in that environment, use ll-cli run --debug.
First export and install the build, because ll-cli run can run only installed applications. In /tmp/org.deepin.demo, export a UAB:
ll-builder export --ref main:org.deepin.demo/1.0.0.0/<arch> --modules binary,develop<arch> is the target architecture, such as x86_64, arm64, or loong64. Use ll-builder list and replace the sample ref with its complete output. Both binary and develop are exported here because debug symbols normally reside in develop. Normal distribution generally ships binary and archives develop for later debugging.
Install the exported UAB:
ll-cli install ./org.deepin.demo_1.0.0.0_<arch>_main.uabReplace <arch> or use the generated file name. Then start the application:
ll-cli run --debug org.deepin.demo--debug starts the application through gdbserver, listening on port 2345 by default. To choose another address:
ll-cli run --debug --debug-listen 127.0.0.1:12345 org.deepin.demoThe terminal displays a message similar to:
Debug mode is enabled. Attach from another terminal with:
  /tmp/linglong-gdb-30e29611-ed83-4032-bd77-aab8a709802d.sh

Generated gdb attach script:
------------------------------------------------------------
#!/bin/sh
set -- -ex 'target remote localhost:2345' "$@"
set -- -ex 'set debug-file-directory /usr/lib/debug:/runtime/lib/debug:/opt/apps/org.deepin.demo/files/lib/debug' "$@"
exec gdb "$@"
------------------------------------------------------------
============================================================
Listening on port 2345
Open another host terminal and run the displayed /tmp/linglong-gdb-...sh helper script to connect GDB to gdbserver.
To debug binaries from the Base or Runtime, enable deepin's debuginfod service with --debug-debuginfod https://debuginfod.deepin.com. Host GDB must be version 10 or later.
You can now set breakpoints on available symbols. For source-level debugging, set the source substitution path in GDB:
set substitute-path /project /tmp/org.deepin.demo/project is the project path in the build environment and /tmp/org.deepin.demo is its host path. Use info source to inspect source information.
Debugging with gdb in vscode
First install the C/C++ extension for VS Code. Because VS Code runs on the host, it connects to the application in the Linyaps container through gdbserver. Start it with ll-cli run --debug --debug-listen 127.0.0.1:12345 org.deepin.demo, then configure launch.json:
{
  "version": "0.2.0",
  "configurations": [
    {
      "name": "(gdb) linglong",
      "type": "cppdbg",
      "request": "launch",
      "program": "${workspaceFolder}/linglong/output/binary/files/bin/demo",
      "args": [],
      "stopAtEntry": true,
      "cwd": "${workspaceFolder}",
      "MIMode": "gdb",
      "miDebuggerServerAddress": "127.0.0.1:12345",
      "setupCommands": [
        {
          "text": "set substitute-path /project ${workspaceFolder}"
        },
        {
          "text": "set debug-file-directory ${workspaceFolder}/linglong/output/develop/files/lib/debug"
        }
      ]
    }
  ]
}
Some configurations need to be changed according to actual project:
"program": "${workspaceFolder}/linglong/output/binary/files/bin/demo",
This is the binary file passed to gdb,
demoneeds to be changed to actual binary filename of project"stopAtEntry": true
This requires gdb to automatically stop at main function, can be set to false if not needed
"miDebuggerServerAddress": "127.0.0.1:12345"
This is the remote address for gdb connection, if port is not default 12345 when starting gdbserver, need to modify to actual port.
"text": "set substitute-path /project ${workspaceFolder}"
This sets source path substitution,
${workspaceFolder}will be automatically replaced by vscode with current working directory, can be modified to actual path if needed."text": "set debug-file-directory ${workspaceFolder}/linglong/output/develop/files/lib/debug"
This sets debug files directory, if debug symbols are not saved to
developmodule, need to modify to actual location.
Debugging with gdb in Qt Creator
Qt Creator also integrates gdb support. After starting Qt Creator, open menu bar Debug -> Start Debugging -> Connect to Debug Server, and fill in the dialog that pops up:
Server Port: `12345`

Local Executable: `/tmp/org.deepin.demo/linglong/output/binary/files/bin/demo`

Working Directory: `/tmp/org.deepin.demo`

Init Commands: `set substitute-path /project /tmp/org.deepin.demo`

Debug Information: `/tmp/org.deepin.demo/linglong/output/develop/files/lib/debug`
Configuration is roughly as shown in figure:
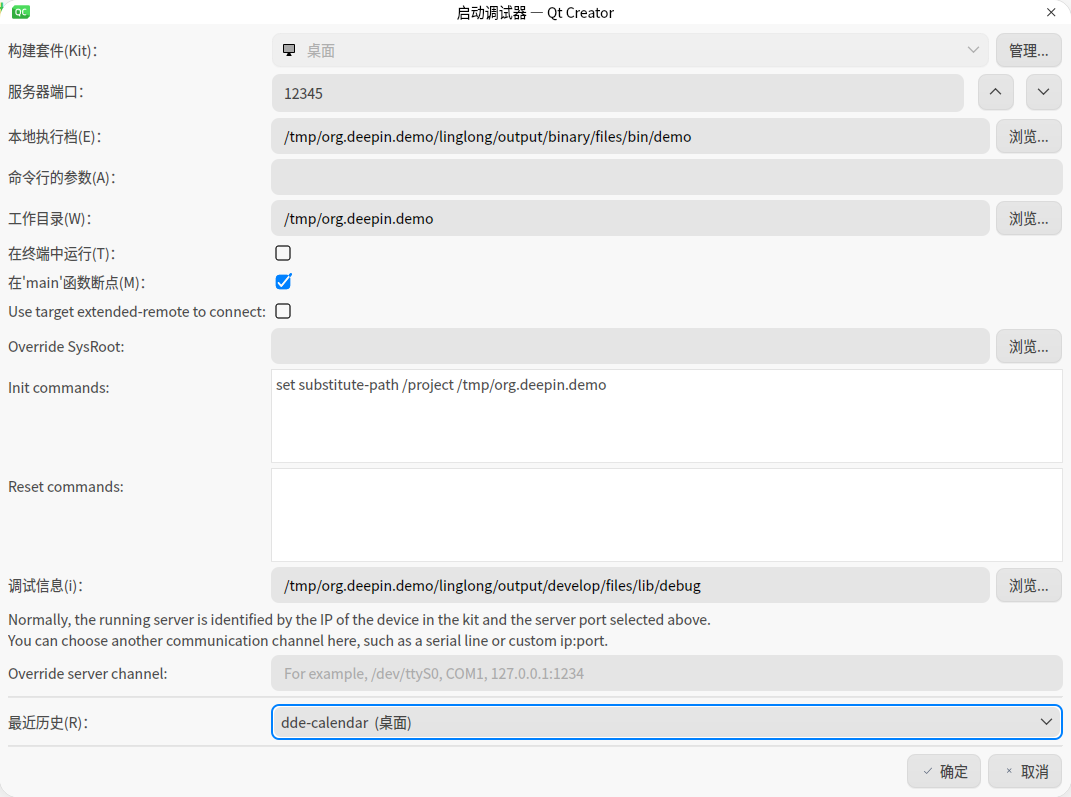
After configuration, QtCreator can be used normally for debugging.
Saving Debug Symbols
Linyaps automatically strips binary debug symbols after building applications and stores them in $PREFIX/lib/debug directory. However, some toolchains strip debug symbols during build process in advance, which causes Linyaps unable to find these symbols in binary files. If your project uses qmake, need to add following configuration in pro file:
# Linyaps sets -g option in CFLAGS and CXXFLAGS environment variables, qmake needs to inherit this environment variable
QMAKE_CFLAGS += $$(CFLAGS)
QMAKE_CXXFLAGS += $$(CXXFLAGS)
# Use debug option to avoid qmake automatically stripping debug symbols
CONFIG += debug
cmake automatically uses cflags and cxxflags environment variables, so no additional configuration is needed. Other build tools can refer to their documentation.
Downloading Debug Symbols from a Debian Repository
By default, the debug mode of ll-cli run automatically downloads the Base's develop module. If debuginfod is configured, matching symbols are downloaded automatically during debugging. If matching fails, download a debug-symbol package manually from the Debian repository corresponding to the Base:
Enter container command line environment using one of the following commands:
bashll-builder run -- bash # or ll-cli run $appid -- bashCheck repository address used by base image:
bashcat /etc/apt/sources.listOpen repository address in host browser and locate directory where dependency library deb packages are located:
- Use command
apt-cache show <package-name> | grep Filenameto check deb package path in repository - Complete download address is: repository address + deb package path
For example, to download debug symbols package for libgtk-3-0:
bashapt-cache show libgtk-3-0 | grep Filename # Output: pool/main/g/gtk+3.0/libgtk-3-0_3.24.41-1deepin3_amd64.deb # Complete directory: <repo-url>/pool/main/g/gtk+3.0/- Use command
Look for corresponding debug symbol packages in that directory, usually has two naming formats:
<package-name>-dbgsym.deb<package-name>-dbg.deb
Download and extract debug symbol package:
bashdpkg-deb -R <package-name>-dbgsym.deb /tmp/<package-name>Configure debugger to find debug symbols: When setting debug-file-directory in scenarios above, append extracted directory, separated by colon:
${workspaceFolder}/linglong/output/develop/files/lib/debug:/tmp/<package-name>/usr/lib/debug
This way debugger can find debug symbols of system dependency libraries in extracted directory.